August 05, 2025
Generally favorable economic data reports, solid corporate earnings reports, some progress on trade agreements, and passage of the One Big Beautiful Bill Act were top headlines during July. These news items improved investor sentiment. In reaction, various equity market indices hit new record highs including the FTSE 100, the S&P 500, and the Nasdaq. Bond yields moved higher as economic growth sentiment improved. Gold prices stabilized while oil prices rose boosted by strong demand amid tight inventory levels.
In the U.S., much of the economic data showed improvement. For example, both the services and manufacturing purchasing managers indices (PMI), the number of job openings, the consumer sentiment index, retail sales, and new home sales were all up from 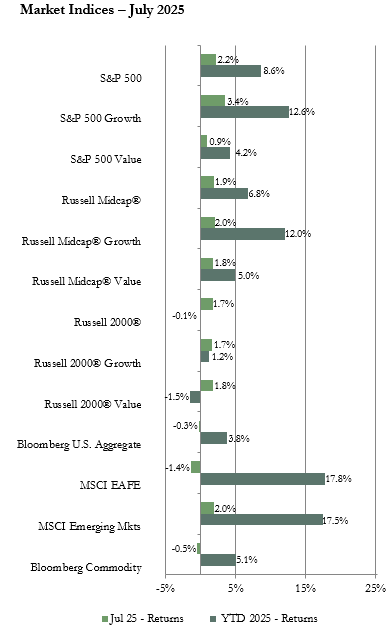 the prior month. The resilent economic data eased pressure on the Federal Reserve (Fed) to cut interest rates. However, the political pressure from the White House to cut rates to lower the cost of financing the federal debt ratcheted up. The Fed left its policy rate unchanged at its July meeting. There was some weakness reported such as durable goods orders declining 9.3% from the prior month and the consumer price index posting the largest monthly increase in five months moving up to 2.7%. In Europe, retail sales fell more than expected and industrial production was muted. In China, the services PMI fell to a nine-month low but the manufacturing index ticked higher. Importantly, the producer price index was -3.6% year-over-year, which was the 33rd consecutive month of weaker producer prices.
The tariff and trade agreement angst continued during the month with Trump’s August 1 deadline approaching. However, uncertainty was eased somewhat with the announcement of trade deals with Japan, the European Union, Vietnam, and the Philippines. Mexico was given a 90-day extension to negotiate.
In the U.S. equity market, each of the three market capitalization (cap) segment indices posted a positive return for July. Earnings season was a main driver of results. The season began with the big money center banks beating estimates benefiting from a rebound in investment banking, higher net interest margins,
and lower reserves for loan losses. Various energy, industrial, consumer, and communications companies also posted positive earnings reports, such as 3M, Coca-Cola, Generac, Netflix, and Verizon. The technology sector was the leader in reported earnings growth driven by artificial intelligence and cloud computing sales. At the other end of the spectrum, various companies in the healthcare sector reported disappointing earnings hurt by higher costs. With risk-on sentiment prevailing during much of the month, the growth sector outperformed value in the S&P 500 and Russell Midcap indices. There was little difference between the returns for growth and value in the Russell 2000.
The MSCI Emerging Markets (EM) index with a positive return for July outperformed the MSCI EAFE index of developed international equities which posted a negative return. Due to a rally in the value of the U.S. dollar, dollar based returns were lower than local currency returns for both the EAFE and EM. Sector performance in the EAFE was led by energy and financials with technology the laggard with a sizeable negative return. The healthcare sector had the highest return among the 11 sectors in the EM index while utilities had the poorest results with a negative return. On a geographical basis, returns were mixed across regions. Among developed international regions, the Eurozone index posted a negative return due to weakening export demand and concerns about trade tariff policy. The Pacific ex Japan region had a positive return. In emerging markets, the Latin America index was the laggard with a negative return while Asian countries such as Thailand and Taiwan had the top returns. The equity market in Thailand reacted positively to signs of political stabilization. Growing demand for AI related products drove equity markets higher in Taiwan.
U.S. bond market sector returns were mixed in July. Most Treasury bond indices along with the mortgage-backed securities and municipal bond indices posted negative returns while the Treasury inflation protected securities index and various corporate bond indices posted small positive returns. Yields generally moved higher during July reflecting resilient economic data. The benchmark 10-year Treasury bond yield started the month at 4.21% but was up to 4.37% at the end of the month. Corporate bonds outperformed Treasury bonds due to strong demand amid moderate issuance of new bonds.
The Bloomberg Commodity index had a small negative return for July. The petroleum sub-index had the top return among indices we track and was up over 8%. Crude oil prices rose due to strong demand and tight supplies. The livestock sub-index also posted a positive return boosted by the price for cattle reaching an all-time high on supply shortages. The precious metals sub-index had a small positive return with gold and silver each up marginally. The industrial metals sub-index was the laggard with a -6% return. The drop in the price of copper was a primary reason for the large decline. The threat of a 50% U.S. tariff on copper imports created a production rush to beat the August 1 deadline which pushed prices down. Good weather in the grain belt of the U.S. raised expectations for a record high harvest which drove grain prices lower.
Vogel Consulting, LLC (Vogel) Tactical Recommendations
Our view continues to be that diversification across regions and asset classes is likely to be beneficial as global economies and markets navigate potentially significant changes to policies as well as business and consumer reactions to those policies. Also, valuations have ratcheted higher again after the tariff induced pullback early in the second quarter. The impact of tariffs is still highly uncertain even though some agreements have been reached. While having deals in place eases some uncertainty and helps businesses to be able to plan, how the agreed upon tariff rates will flow through to the U.S. inflation rate and to U.S. and foreign corporate earnings is highly uncertain. For now, the U.S. economy appears solid enough to withstand the current uncertainty. The labor market has been resilient creating above 100,000 new jobs per month with the number of new unemployment claims staying steady at a low level and wage growth slowing but still above the inflation rate. However, some cracks are starting to show in the labor market such as that while lay-offs have not spiked it is taking longer for the unemployed to find a new job. The Fed continues to be in a wait and see mode before loosening monetary policy by lowering interest rates. Corporate earnings may slow as tariff impacts flow though the economy. However, analysts are still expecting positive earnings growth for 2025. International markets have outperformed the U.S. so far this year and while tariff policies will impact those regions also, stimulus measures may boost economic activity, earnings, and financial markets further in those regions. However, the boost to international returns for U.S. investors from a weakening dollar has been waning recently and may not provide the same tailwind to returns as in the first half of the year.
Our current recommendations are for a neutral weight position in U.S. and international developed equities with an underweight to emerging markets equities. Our neutral view on growth relative to value remains in place as we prefer to have exposure to sectors benefiting from longer-term secular growth trends along with some exposure to cyclicality. Since bond yields are still attractive, we retain our equal weight recommendation for fixed income. We favor short to intermediate maturity bonds. We recommend an underweight allocation to hedge funds. We continue to recommend an overweight to cash reserves to avoid having to sell assets in a down market period to cover spending needs since markets are likely to be volatile throughout the year in reaction to policy, earnings, and economic news.
The statistical information contained in this commentary has been compiled from publicly available sources and is presented to you for your review and for discussion purposes only. The information contained in this commentary represents the opinion of the author(s) as of its date and is subject to change at any time due to market or economic conditions. These comments do not constitute a recommendation to purchase, sell or hold any security, and should not be construed as investment advice or to predict future performance. Past performance does not guarantee future results.
The statistical information contained in this commentary was derived from sources that Vogel Consulting, LLC believes are reliable, and such information has not been independently verified by Vogel. Russell Investment Group is the source and owner of the trademarks, service marks and copyrights related to the Russell Indexes. Russell® is a trademark of the Russell Investment Group. An index is not managed and is unavailable for direct investment.
Print: Download PDF: