November 12, 2025
October returns were positive across major global asset classes. However, as usual, markets moved up and down in reaction to news items. In the first part of the month, U.S. equities turned lower after President Trump threatened a new 100% tariff on Chinese goods after China put controls on rare earth mineral exports and the minutes from the September Federal Reserve (Fed) meeting showed only a slim majority support for more rate cuts. Global equities fell on trade war worries and a cease fire in the Middle East dampened European defense stocks. The price of oil fell to a five-month low as OPEC+ signaled a boost in production, U.S./China trade tension ratcheted up, and the cease fire in Gaza eased supply disruption concerns. Gold continued to move higher on geopolitical uneasiness. Then the corporate earnings season began with strong reports from big banks, anything artificial intelligence (AI) related, as well as others such as 3M and Coca-Cola. In addition, the 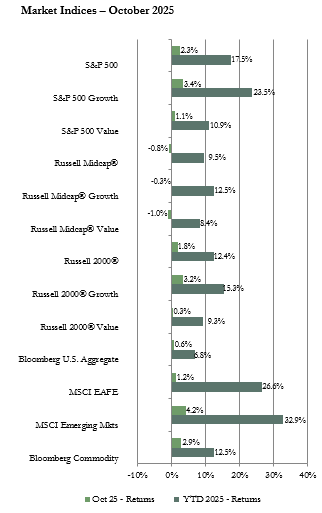 consumer price index inflation report came in softer than expected which gave the Fed room to deliver a quarter percentage point cut to its fed funds interest rate. In reaction to these events, stock prices trended up. U.S. and Asian stocks rallied further on announcements that trade agreements or frameworks had been reached with China, Japan, South Korea, Malaysia, Cambodia, Thailand, and Vietnam. Sixty percent of global equity indices hit all time highs in October, including in the U.S, Europe, Japan, South Korea, and Taiwan. Gold and safe haven assets declined late in the month as sentiment improved. Oil prices turned higher late in the month after Trump increased sanctions on Russia’s two largest oil companies.
Economic data continues to be mixed around the world. In the U.S much of the data is not available because of the government shutdown. However, some private sourced data was available such as the consumer sentiment index that fell to 55.0 and the small business optimism index that declined to 98.8. In addition, the Institute for Supply Management’s services purchasing managers index (PMI) declined to 50, which is the dividing point between expansion and contraction. However, the manufacturing index improved to 49.1. Outside the U.S., industrial production in Germany was down 5.2%. Retail sales in the United Kingdom rose more than expected and rose for the fourth consecutive month. The Eurozone composite
PMI showed the strongest increase in new orders in over two years. In China, industrial output was up 6.5% in September, but retail sales grew at only 3% year-over-year, which was the slowest pace in almost a year.
In the U.S. equity market, the large-capitalization (cap) index had the top return driven higher by strong earnings reports especially for AI related business stories, anticipation for an interest rate cut by the Fed, and easing trade tensions. About 80% of S&P 500 companies that reported earnings in October beat consensus expectations. The rally did broaden out to extend to the small-cap sector with the return for the Russell 2000 index marginally behind the return for the S&P 500. Just as in September, anticipation of the Fed rate cut provided a boost in confidence for the small-cap sector since small-cap stocks tend to be more interest rate sensitive than larger-cap stocks. The mid-cap asset class lagged with the Russell MidCap index posting a negative return of under 1% due to weakness in the consumer discretionary, energy, utilities, and materials sectors. Consumer staples was weak in each market cap segment again this month due to worries about lower income consumers tightening spending and as investors focused on AI and interest rate sensitive stocks. Communications, information technology, and healthcare were the best performing sectors in each market cap segment.
The MSCI EAFE index of developed international equities had a moderate positive return but lagged the return for the S&P 500. In contrast, the MSCI Emerging Markets (EM) index posted a return of over 4% that outperformed U.S. and developed international indices. The U.S. dollar rose during October which lowered foreign asset returns for U.S. based investors. The currency impact was more of a headwind for the EAFE index than the EM index. The growth index outperformed the value index in both the EAFE and EM. Information technology was the sector performance leader in the EAFE and EM reflecting the boom in AI related spending. The financials sector was the laggard in the EAFE index while consumer discretionary lagged in the EM. On a geographical basis, among developed international regions, Portugal was the performance leader reflecting improving economic growth data. Japan also had a strong return boosted by the election of Sanae Takaichi as prime minister since she is expected to pursue expansionary policies. In emerging markets, increasing demand for semiconductors for AI projects and new trade agreements with the U.S. drove the South Korean and Taiwanese stock indices to top returns. The China index posted a negative return hurt by the trade tension flare-up early in the month and by continued weak economic data such as a drop in export orders, weak domestic demand, and continued declines in property values.
Bond yields in the U.S. trended lower for much of the month in anticipation of a rate cut by the Fed. The yield on the 10-year Treasury bond dipped to the 4% level, the lowest since April. However, yields moved higher again when Fed Chair Powell commented after the Fed meeting that another rate cut in December is not a sure thing. Short-term and long-term bond yields ended the month with larger declines than intermediate bond yields. Returns for the month were positive across all bond sectors. Long maturity bonds posted the highest returns. The municipal bond index had a particularly good return due to strong investor demand amid limited new supply of bonds. The benchmark 10-year U.S. Treasury bond yield started the month at 4.16% and ended the month at 4.11%. With the latest Fed rate cut, the yield on the 3-month Treasury bill is now under 4% for the first time in three years.
Gains in the commodity market were widespread resulting in the commodity index posting a return of almost 3%. Of the sub-indices we track, only livestock, which was hurt by worries about higher imports, had a negative return. The grains sub-index had the highest return boosted by a pledge by China to restart soybean imports as part of trade negotiations. Industrial metals prices also moved higher on easing trade tensions. Gold and silver had solid returns on safe haven demand. The price of gold shot past $4,000 per ounce for the first time in reaction to trade tensions, political crisis in France, and the U.S. government shutdown uncertainties. However, the price dropped near month-end when the Trump/Xi meeting eased trade tensions and sparked profit taking.
Vogel Consulting, LLC (Vogel) Tactical Recommendations
As is often the case, capital market participants are currently navigating mixed signals. Earnings have been resilient for the most part, AI investment is providing a boost to companies in various industries and is driving expectations for increased productivity across the economy, and businesses and consumers are looking forward to the benefits of declining interest rates. In addition, it is expected that many Americans will be getting a larger tax refund in 2026 since tax cuts in the One Big Beautiful Bill were backdated to the start of 2025. The larger refunds are likely to be spent providing a boost to economic activity in the first part of next year. However, questions remain about the flow through of tariff impacts, the labor market is clearly slowing which could dampen spending and investment, and asset prices are high in many sectors particularly large-cap technology, communications, and other AI related stocks. Therefore, our view continues to be that diversification across regions and asset classes is likely to be beneficial as global economies and markets navigate potentially significant changes to policies as well as business and consumer reactions to those policies. Policy makers and investors will be closely watching data for clues to the outlook for economic activity and the impact on corporate earnings so we expect periods of volatility as markets react to cross currents in the news.
Our current recommendations are for a neutral weight position in U.S., international developed, and emerging markets equities. The emerging markets recommendation was recently changed to equal weight from underweight. The change was made due to the expectation for the dollar to continue to gradually weaken, which provides a boost to foreign investments for U.S. investors, and the easing of trade tensions now that several countries have reached agreements with the U.S.
Our neutral view on growth relative to value remains in place as we prefer to have exposure to sectors benefiting from longer-term secular growth trends along with some exposure to cyclicality. Since bond yields are still attractive, we retain our equal weight recommendation for fixed income. We favor short to intermediate maturity bonds. We recommend an underweight allocation to hedge funds. We continue to recommend an overweight to cash reserves to avoid having to sell assets in a down market period to cover spending needs since markets are likely to be volatile throughout the year in reaction to policy, earnings, and economic news.
The statistical information contained in this commentary has been compiled from publicly available sources and is presented to you for your review and for discussion purposes only. The information contained in this commentary represents the opinion of the author(s) as of its date and is subject to change at any time due to market or economic conditions. These comments do not constitute a recommendation to purchase, sell or hold any security, and should not be construed as investment advice or to predict future performance. Past performance does not guarantee future results.
The statistical information contained in this commentary was derived from sources that Vogel Consulting, LLC believes are reliable, and such information has not been independently verified by Vogel. Russell Investment Group is the source and owner of the trademarks, service marks and copyrights related to the Russell Indexes. Russell® is a trademark of the Russell Investment Group. An index is not managed and is unavailable for direct investment.
Print: Download PDF: