September 07, 2023
Investor sentiment shifted in August and broad global equity, bond, and commodity market returns were negative for the month. For most of the month, bond yields moved up (and prices went down). The move in yields was fueled by a return to “higher for longer” interest rate expectations because data reports continue to show economic resiliency, particularly in the U.S, despite higher than target inflation rates and central bank comments that continue to be hawkish. Higher bond yields make stocks look more expensive when discounting future earnings, which drove equity prices lower. Some weaker than expected earnings reports, especially from retailers, also pressured stock prices. Oil prices rose but prices for many other commodities moved lowered in part because of the weakness in the Chinese economy.
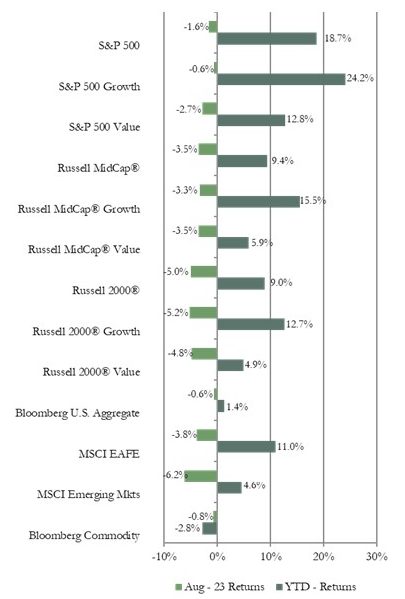
Market Indices – August 2023
 Inflation data in the U.S. and Europe was little changed in the latest reports and continues to be above central bank targets. The Bank of England raised its policy rate another quarter of a percentage point early in August. Comments from Federal Reserve (Fed) Chair Powell in the annual Jackson Hole meeting speech indicated the Fed remains data dependent and intends to continue to tighten policy if needed to contain inflation. Comments from members of the European Central Bank echo that stance. One of the reasons central banks remain hawkish is that labor markets in developed economies continue to be strong which is supporting economic activity. The unemployment rate in the euro area dropped to 6.4%, which is a record low. In the U.S., the latest unemployment rate was 3.5% with wages growing at 4.4% over the prior year. The tight labor market provided a boost to retail sales in the U.S. which rose at a surprisingly strong rate of 0.7% over the prior month.
Each major U.S. equity market index posted a negative return for the month. The S&P 500 index declined less than the Russell MidCap index which declined less than the Russell 2000 index of small-capitalization (cap) stocks. The growth index outperformed the value index in the S&P 500 index and the Russell MidCap but the opposite occurred in the Russell 2000 index. Sector returns were similar in the large-cap and mid-cap indices with energy and communications posting the best returns and utilities lagging. Energy was the top performing sector in the small-cap index but that is where similarities with sector returns in the other two market cap indices ended. For example, healthcare and communications had the lowest returns in the Russell 2000 index, but those sectors were among the better performing sectors in the S&P 500 and Russell MidCap indices.
Both the MSCI EAFE index of developed international equities and the MSCI Emerging Markets index (EM) had a negative return for August on a U.S. dollar basis. The EM index lagged the EAFE index and the S&P 500. Both the EAFE and EM indices had a better return on a local currency basis since the dollar advanced during much of the period. The value index outperformed the growth index in both the EAFE and EM indices. Energy was the top performing sector and consumer discretionary had the lowest return in both indices. On a geographical basis, Japan was one of the best performing developed international countries reflecting the strong economic data reported there. Japan’s second quarter gross domestic product growth was 6%, well above the 3.7% growth in the first quarter. New Zealand was the worst performing region among developed markets due in part to commodity price weakness related to the troubles in the Chinese economy. Among emerging markets, Egypt and Turkey had the best performance each with a positive return. China was again among the weakest performing emerging market countries. Chinese equity prices continued to be pressured by the property sector debt problems, high unemployment, and weaker than expected consumer spending and exports despite some modest stimulus moves by the Chinese government.
U.S. bond market sector returns were mixed for August resulting in a small negative return for the Bloomberg U.S. Aggregate Bond index. Yields moved up during most of the month (and prices went lower) reflecting stronger than expected economic data and indications from the Fed that additional interest rate hikes are possible if the inflation rate stays above the target level. However, that stronger than expected economic data provided a boost to the corporate high yield sector and the index for that sector posted a positive return. Short and intermediate Treasury and corporate bond indices also had positive returns. However, returns for longer maturity bonds were negative. The municipal and mortgage-backed securities indices also had negative returns. The yield curve remains very steeply inverted. The 3-month Treasury bill yield was 5.6% at month-end compared to the 2-year Treasury bond yield of 4.9% and the 10-year Treasury bond yield of 4.1%.
The Bloomberg Commodity index had a negative return for the month. Of the sub-indices we track only energy and petroleum had a positive return. Those indices were boosted by higher crude oil prices. Oil prices rose due to tightening inventory levels as a result of production cuts. The grains index had the largest decline with prices moving lower as expectations for harvest yields increased. The industrials metals sub-index was another particularly weak performer reflecting the continuing global manufacturing slowdown and the property sector issues in China.
Vogel Consulting, LLC (Vogel) Tactical Recommendations
The economy has been resilient with gross domestic product and corporate profit reports coming in better than expected, the labor market remaining tight, and inflation cooling. However, inflationary pressures persist. Therefore, even though consensus is building that the Fed and other central banks are near the end of rate hikes, the possibility of further rate hikes remains and expectations that rates will remain high for an extended period are increasing. In addition, bank lending standards have been tightening for a few months with the latest report showing more tightening. The resumption of student loan payments later this year adds some uncertainty about the outlook for consumer spending. These factors could be a drag on economic and profit growth. With valuations up from the start of the year, periods of market volatility are likely in reaction to new reports while there is heightened uncertainty about the impact of tighter monetary conditions on corporate profits. We continue to recommend an overweight to cash reserves to avoid having to sell assets in a down market period to cover spending needs. Our neutral view on growth relative to value remains in place as we prefer to have exposure to sectors benefiting from longer-term secular growth trends along with some exposure to cyclicality.
We retain our neutral weight position recommendation for developed market and emerging market equities. Since bond yields are more attractive than they have been in many years, we encourage investors to revisit fixed income allocations. Our fixed income recommendation is for an equal weight position relative to long-term targets. We favor shorter maturity bonds due to the steeply inverted yield curve. We recommend an underweight allocation to hedge funds. Within the hedge fund sector our view is that the opportunity set for distressed investing strategies may be improving as interest rates are at multi-year highs and credit conditions are tightening.
The statistical information contained in this commentary has been compiled from publicly available sources and is presented to you for your review and for discussion purposes only. The information contained in this commentary represents the opinion of the author(s) as of its date and is subject to change at any time due to market or economic conditions. These comments do not constitute a recommendation to purchase, sell or hold any security, and should not be construed as investment advice or to predict future performance. Past performance does not guarantee future results.
The statistical information contained in this commentary was derived from sources that Vogel Consulting, LLC believes are reliable, and such information has not been independently verified by Vogel. Russell Investment Group is the source and owner of the trademarks, service marks and copyrights related to the Russell Indexes. Russell® is a trademark of the Russell Investment Group. An index is not managed and is unavailable for direct investment.
Print: Download PDF: