July 07, 2023
Equity markets moved higher in June as data releases pointed to more resilient economies than many previously forecast. Receding inflation rates in various countries provided a boost to equity markets although the core rates remain“sticky” and well above central bank targets. In the U.S., the consumer price index (CPI) grew 4.0% over the prior year in May, which was down from 4.9% in April and was the slowest rate of increase since March 2021. However, the core CPI had a much smaller decline only moving down to 5.3% in May from 5.5% in April. Equity markets were also fueled by still strong consumer spending and labor market data in the U.S. and Europe and improved housing market data which raised expectatons that the U.S. economy will side step recession this year. The macroeconomic data improved investor sentiment and the S&P 500 and Nasdaq stock indices reached 14-month highs. The S&P 500 index also exited its bear market by posting a 24% gain since its low in October 2022. Multi-year highs were not limited to the U.S. Japan’s stock market indices reached 33-year highs on upwardly revised first quarter economic growth data and a rebound in foreign tourism that is boosting the service sector.
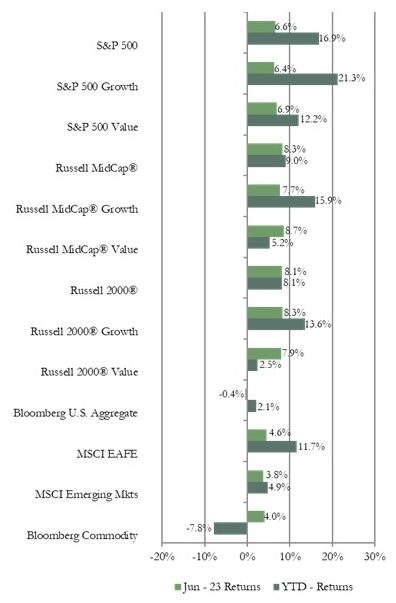
Market Indices – June 2023
 Bond market returns were weaker since yields moved higher. The 10-year U.S. Treasury yield closed June at 3.81%, the highest level since before the banking crisis in March. The Federal Reserve (Fed) held its key policy rate steady at its June meeting. However, the Fed talked about further tightening and its forecast pointed to two more rate hikes this year which pushed bond yields up. Several other central banks increased rates in June including the Bank of Canada and the Reserve Bank of Australia that resumed rate hikes after pausing at previous meetings.
In other key news, China’s reopening appears to continue to lose momentum. The government reacted by cutting three interest rates to attempt to boost the economy. The manufacturing sector around much of the world also continues to be weak with many purchasing manager index reports remaining under 50, which indicates contraction, including in the U.S., Australia, Brazil, Canada, South Korea, and the eurozone.
Major U.S. equity market index returns were strong in June. The equity market rally broadened a bit since both the Russell Midcap index and Russell 2000 index of smaller companies outperformed the S&P 500 index of larger capitalization (cap) stocks. The value index outperformed the growth index in the Russell Midcap and the S&P 500 index but growth outperformed value in the Russell 2000. The decline in recession worries drove the more cyclical sectors, such as industrials, materials, and consumer discretionary, to double-digit gains in each of the three market cap indices. The risk-on sentiment made the more defensive sectors out of favor so they were the performance laggards for the month. After spiking higher in May on the artificial intelligence wave, the information technology sector cooled with returns in the middle of the pack in June.
Both the MSCI EAFE index of developed international equities and the MSCI Emerging Markets index (EM) had a positive return for June on a U.S. dollar basis, but lagged U.S. equity index returns. The dollar based returns for both the EAFE and EM were higher than the local currency returns since the dollar declined modestly during the month. Value stocks outperformed growth stocks in both the EAFE and EM. Just as in the U.S. indices, the more cyclical sectors had the best returns in foreign markets. Interestingly, the healthcare sector had the lowest return in both the EAFE and EM indices. On a geographical basis, the euro area was the best performing region among developed markets boosted by strong returns for Italy and Spain. Latin America was the top performing region among emerging markets with a double-digit return. Poland was also a strong performer with a double-digit return on declining inflation and improving business sentiment. After posting a negative return for the prior two months, the China index had a modest positive return in June in reaction to stimulus measures.
U.S. bond market sector returns were mixed for June resulting in a small negative return for the Bloomberg U.S. Aggregate Bond index. Yields on all but the very shortest term and the longest term Treasury and investment grade corporate bonds moved up during the period (and prices went lower) reflecting stronger than expected economic data and indications from the Fed that additional interest rate hikes are likely due to still too high inflation rates. However, that stronger than expected economic data provided a boost to the corporate high yield sector, which was the best performing sector with a return of nearly 2%. The municipal bond index also had a positive return due to strong investor demand. The yield curve continues to be very steeply inverted. The 3-month Treasury bill yield was 5.4% at month-end compared to the 2-year Treasury bond yield of 4.9% and the 10-year Treasury bond yield of 3.8%. The 10-year Treasury yield closed June at the highest level since early March before the collapse of Silicon Valley Bank.
The Bloomberg Commodity index had a positive return for the month. Each of the sub-indices we track had a positive return except precious metals. The livestock sub-index had the highest return reflecting tight supply. The energy sub-index was another top performer with a return of over 8%. Much of the gain was due to the almost 20% increase in the price of natural gas boosted by high electricity usage as hot weather covers much of the U.S. The hot weather and drought conditions also boosted the return for the grains sub-index. Gold retreated after upbeat economic data releases during the month reduced the demand for safe haven assets.
Vogel Consulting, LLC (Vogel) Tactical Recommendations
Inflationary pressures continue to persist as shown by the latest release of the Fed’s preferred measure of inflation, the core personal consumption expenditures price index, which at 4.6% is well above the Fed’s 2% target. Therefore, the possibility of further rate hikes remains – especially since the Fed and other central banks continue to have a hawkish tone in their recent comments. Bank lending standards have been tightening for a few months and may continue to do so as banks seek to retain liquidity and reduce risk which could reduce access to credit for consumers and business, particularly small businesses that depend on regional and community banks. The resumption of student loan payments later this year adds some uncertainty about the outlook for consumer spending. These factors could be a drag on economic growth even though the economy has been showing resilience so far largely due to the strength of the labor market. Therefore, it is likely financial markets could be volatile while there is heightened uncertainty about the impact of tighter monetary conditions on corporate profits. We continue to recommend an overweight to cash reserves to avoid having to sell assets in a down market period to cover spending needs. Our neutral view on growth relative to value remains in place as we prefer to have exposure to sectors benefiting from longer-term secular growth trends along with some exposure to cyclicality.
We retain our neutral weight position recommendation for developed market and emerging market equities. Since bond yields are more attractive than they have been in many years, we encourage investors to revisit fixed income allocations. Our fixed income recommendation is for an equal weight position relative to long-term targets. We favor shorter maturity bonds due to the steeply inverted yield curve. We recommend an underweight allocation to hedge funds. Within the hedge fund sector our view is that the opportunity set for distressed investing strategies may be improving as interest rates are at multi-year highs and credit conditions are tightening.
The statistical information contained in this commentary has been compiled from publicly available sources and is presented to you for your review and for discussion purposes only. The information contained in this commentary represents the opinion of the author(s) as of its date and is subject to change at any time due to market or economic conditions. These comments do not constitute a recommendation to purchase, sell or hold any security, and should not be construed as investment advice or to predict future performance. Past performance does not guarantee future results.
The statistical information contained in this commentary was derived from sources that Vogel Consulting, LLC believes are reliable, and such information has not been independently verified by Vogel. Russell Investment Group is the source and owner of the trademarks, service marks and copyrights related to the Russell Indexes. Russell® is a trademark of the Russell Investment Group. An index is not managed and is unavailable for direct investment.
Print: Download PDF: