June 05, 2025
The financial market roller coaster continued during May with trade policy announcements continuing to be the dominant drivers of market movements. The month started with a rally set-of by the non-farm payroll report exceeding expectations and technology companies reporting strong earnings. Stocks pulled back after the Institute of Supply Management’s services activity report showed higher than expected prices paid and Federal Reserve (Fed) chair Powell made post Fed meeting comments that the risk of higher inflation and higher unemployment have increased due to trade policy. Then a U.S. trade deal with the United Kingdom was announced and stock prices went up. Days later stock prices spiked even higher after a de-escalation of reciprocal tariffs between the U.S. and China was announced and the consumer price index report showed that inflation declined to a 2.3% annual rate, the lowest since early 2021. During the rally, the S&P 500 index returned to 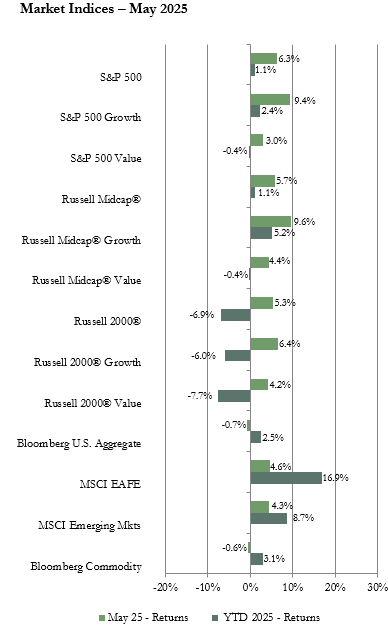 positive return territory for the year-to-date after the sharp correction in the first part of the year. However, the rally stalled after President Trump threatened to raise tariffs on the European Union (EU) to 50% and tariffs on iPhones to 25%. In reaction to that news, Treasury bond yields rose (and prices fell) to the highest level since February on risk-off trading. The sell-off in the bond market deepened on fears that investors were moving out of U.S. assets due to rising Japanese yields in addition to the trade uncertainty. (Japanese yields rose to the highest levels since 2008.) However, markets reversed again after Trump delayed the increase in EU tariffs to allow for negotiations, the consumer confidence report jumped, and the Fed’s preferred inflation gauge, the core personal consumption expenditures index, came in lower than expected. After the ups and downs, the major global equity indices ended May with strong positive returns, many bond market sectors posted negative returns, oil was up, and gold was little changed from the prior month-end.
In other key economic news, various countries lowered interest rates citing heightened trade related uncertainty. For example, the Bank of England, Czech National Bank, South Korea’s, central bank, and Poland’s central bank each lowered their key interest rate during the month. Economic activity measured by gross domestic product (GDP) was mixed. For example, in the U.S. the first quarter GDP rate was -0.3%, the first negative reading since 2022, due to the sharp increase in imports ahead of tariffs. GDP grew 0.4% in the Eurozone and 0.7% in the United Kindgom, but was down 0.7% in Japan. In the U.S., existing home sales hit the lowerst level since 2009 in April while the median sale price rose to $414,000. However, new home sales were up to an annual rate of 743,000, above expectations, with the median sales price down 2% year-over-year. China announced more stimulus actions aimed at improving liquidity in that economy.
In the U.S. equity market, each of the three market capitalization (cap) segment indices posted a strong positive return for May boosted by the temporary de-escalation of trade tensions between the U.S. and China, positive inflation news, and better than expected earnings from technology companies. The larger cap index, the S&P 500, had the top return followed by the mid-cap index, which outperformed the small-cap index. Growth outperformed value in each market cap category in large part because of the sharp rally in technology stocks. Technology was the top performing sector in the S&P 500 and Russell 2000 indices and the second best performing sector in the Russell MidCap index. With the risk-on sentiment prevailing during much of the month, defensive sectors including consumer staples, healthcare, and utilities had the lowest sector returns in each market cap category.
Both the MSCI EAFE index of developed international equities and the MSCI Emerging Markets (EM) index posted a positive return on a U.S. dollar basis. Currency moves had less of an impact on returns than in prior months this year but provided a small boost to the returns for both indices since both had a modestly lower return on a local currency basis. There was little difference between the return for the EAFE and the EM indices in May. Sector performance in both the EAFE and EM was led by the technology and industrials sectors with defensive sectors lagging. On a geographical basis, returns were solid across developed international regions but European countries had the best returns fueled by optimism about increased defense spending as well as positive inflation trends. In emerging markets, the Emerging Europe index had the top regional return led by the double-digit gain for Greece. China had a modest positive return.
Sector returns in the U.S. bond market were mixed for the month. The short-term Treasury, short credit, intermediate credit, corporate high yield, and municipal bond indices had a positive return but all other sectors had a negative return resulting in a negative return for the Bloomberg U.S. Aggregate Bond index. Bond prices/yields continued to be volatile in reaction to uncertainty around the potential inflationary and earnings growth impact of tariff policies and questions about future Fed rate decisions. The benchmark 10-year Treasury bond yield started the month at 4.17% but rose to 4.41% by May 30. With the rise in Treasury bond yields, the average 30-year fixed mortgage rate climbed to close to 7% again according to FreddieMac.
The Bloomberg Commodity index had a negative return for May with mixed sub-index results. The petroleum and livestock sub-indices each had a strong return of over 3%. The industrial metals return was also positive. However, the grains and precious metals sub-indices were down for the month. Good planting conditions pushed gain prices lower while precious metals prices retreated as the demand for safe haven assets was tempered by the shift to risk-on sentiment.
Vogel Consulting, LLC (Vogel) Tactical Recommendations
Our view continues to be that diversification across regions and asset classes is likely to be beneficial as global economies and markets navigate and adjust to potentially significant changes to policies and business and consumer reactions to those policies. The impact of tariffs is a continuing risk to corporate earnings and financial market performance. However, the inflation and growth implications of those tariff actions are uncertain due to the fluid nature of the actions and negotiations. For now, the U.S. economy appears solid enough to withstand the current uncertainty. The labor market is resilient creating above 100,000 new jobs per month with the number of new unemployment claims staying steady at a low level and wage growth slowing but still above the inflation rate. Corporate earnings are likely to slow and analysts have lowered their estimates. However, analysts are still expecting positive earnings growth for 2025. International markets have outperformed the U.S. so far this year and while tariff policies will impact those regions also, stimulus measures and potentially additional interest rate cuts may boost economic activity, earnings, and financial markets further in those regions.
Our current recommendations are for a neutral weight position in U.S. and international developed equities with an underweight to emerging markets equities. Our neutral view on growth relative to value remains in place as we prefer to have exposure to sectors benefiting from longer-term secular growth trends along with some exposure to cyclicality. Since bond yields are still attractive, we retain our equal weight recommendation for fixed income. We favor short to intermediate maturity bonds. We recommend an underweight allocation to hedge funds. We continue to recommend an overweight to cash reserves to avoid having to sell assets in a down market period to cover spending needs since markets are likely to be volatile throughout the year in reaction to policy, earnings, and economic news.
The statistical information contained in this commentary has been compiled from publicly available sources and is presented to you for your review and for discussion purposes only. The information contained in this commentary represents the opinion of the author(s) as of its date and is subject to change at any time due to market or economic conditions. These comments do not constitute a recommendation to purchase, sell or hold any security, and should not be construed as investment advice or to predict future performance. Past performance does not guarantee future results.
The statistical information contained in this commentary was derived from sources that Vogel Consulting, LLC believes are reliable, and such information has not been independently verified by Vogel. Russell Investment Group is the source and owner of the trademarks, service marks and copyrights related to the Russell Indexes. Russell® is a trademark of the Russell Investment Group. An index is not managed and is unavailable for direct investment.
Print: Download PDF: