January 07, 2025
2024 can be described as a record setting year for equities and other assets. Record highs started at the beginning of the year and continued through December. The S&P 500 and Nasdaq indices hit record highs in January. In February, Japan’s Nikkei 225 hit its first new high since 1989. European markets joined the record setters with the Stoxx 600 hitting a new high in March and the FTSE 100 hitting a new high in May. In India, the Sensex hit a new high in September. These indices hit more new highs as the year went on. The S&P 500 set its 57th record high for 2024 in December. Enthusiasm for the growth potential of artificial intelligence (AI) stocks, resilient economic activity in the U.S., and improving economic conditions in Japan were key drivers of the equity market gains. However, the most significant driver of the gains was the expectations for, and the actual, beginning of easing of monetary policy in the much of the world. The Swiss National Bank set off the interest rate cutting cycle by lowering its borrowing cost in March. The 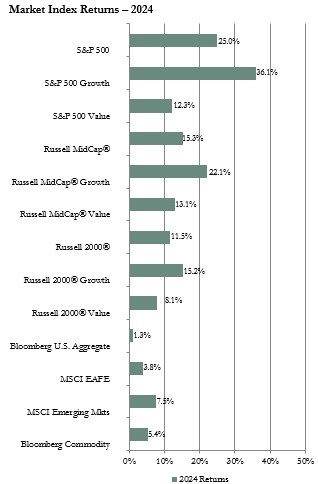 European Central Bank started its rate cuts in June and made three more cuts before year-end. Other European countries, Canada, and New Zealand cut rates multiple times during the year. The U.S. Federal Reserve (Fed) joined in with its first change in interest rate policy since July 2023 with a surprisingly large half percentage point cut in September. The Fed made further cuts of a quarter of a percentage point each in November and December. Markets rallied on the moves. Rate cuts and the resilient U.S. economy drove the value of the U.S. dollar up to the highest level since 2022. Gold was another record setter reaching multiple new highs throughout the year rising to as high as $2,790 per ounce in October. Robust demand from central banks, investors seeking safe haven assets, and interest rate cuts drove the price of gold higher in 2024.
Despite all the record highs, markets experienced brief periods of downward volatility. These sell-offs were mostly in reaction to shifts in expectations for interest rate cuts due to strong economic data and sticky inflation. One of the largest pullbacks was in April when equity and bond markets recalibrated expectations for rate cuts because the U.S. consumer price index (CPI) report rose to 3.5% year over year, the highest in 12 months and more than forecast. The most significant equity market pullback occurred in
August. Unexpectedly weak labor market and manufacturing reports in the U.S. started the sell-off on worries the Fed was too late in cutting interest rates risking a recession. The sell-off deepened when the Bank of Japan raised its key interest rate for the first time in 17 years and the subsequent rise in the value of the yen set off a swift unwinding of yen carry trades. The Nasdaq fell over 10% officially hitting a correction and the Nikkei 225 fell over 12%. The S&P 500 index narrowly avoided a correction, dropping only 8.5%. U.S. bond prices rose sharply on safe haven trading with Treasury bond yields hitting lows for the year. However, equity markets rebounded after Fed Chair Powell’s comments at the August Jackson Hole symposium saying, “ the time has come for policy to adjust.”
Another significant outcome of Chair Powell’s comments was that the Treasury yield curve, which had been inverted (short-term bond yields higher than long-term bond yields) since October 2022 began to normalize as investors came to expect multiple interest rate cuts. The yield curve uninverted in September after the Fed made its first rate cut since July 2020. Yields across the maturity curve, except for the shortest maturity bonds, moved higher into year-end reflecting investors’ outlook for stronger growth, higher inflation, and fewer rate cuts than expected earlier in the year. The 10-year Treasury bond yield ended the year at 4.58%, up considerably from 3.88% at year-end 2023.
Events in China were also significant to financial markets in 2024. The Chinese economy continued to be weak as the property sector issues, local government debt levels, and weak consumer spending dampened economic activity. Chinese equity prices fell in the first half of the year. The government announced various stimulus measures during the year that were generally ineffective since none were focused on resolving structural issues in the economy or on stimulating consumer spending until near year-end when the government said it would adopt looser monetary policy. Chinese equities moved higher in the second half of the year on optimism about stimulus measures. The weak demand from China hurt commodity prices throughout the year and was a drag on foreign company sales to China. This particularly hurt European manufacturers and luxury good companies.
Political events were another notable impact on financial markets throughout the year. For example, the surprisingly strong win for Claudia Sheinbaum as the new president of Mexico sent Mexican stock prices down sharply due to worries that the new president will work to dismantle constitutional checks on executive power. French financial markets were down significantly in reaction to political turmoil set off by a call for a snap election that led to worries about a financial crisis if either the far right or left won due to pledges of heavy fiscal spending. Many sectors of global financial markets were impacted by Donald Trump’s win in the U.S. presidential election. Optimism surrounding Trump’s pro-business policies drove U.S. equity prices higher. However, bond yields rose, and prices moved lower, on concerns that Trump’s threatened tariffs and deportations of illegal immigrants will be inflationary. The dollar strengthened on expectations for robust economic growth due to Trump’s “America First” policies. The higher bond yields and dollar sent gold prices down. Equities in several of the largest U.S. trading partners, such as China and Mexico, were pressured by concerns about the impact of potential new tariffs on imports to the U.S.
Asset Class Reviews:
Major U.S. equity indices generated double-digit gains for the year. This was the second consecutive year of double-digit gains. Fueled by the AI frenzy and the gains by the investor favorite Magnificent 7 stocks, the large-capitalization (cap) S&P 500 index outperformed the Russell Mid Cap and Russell 2000 indices by a wide margin. Growth outperformed value by a sizeable margin in each of those three indices. The communications sector was the top performing sector in each market cap category. Materials was the poorest performing sector with a negative return in the S&P 500 and Russell Mid Cap. Energy was at the bottom of the performance ranking in the Russell 2000 index, also with a negative return.
Both the MSCI EAFE and MSCI Emerging Markets (EM) index posted a positive return for 2024 but returns for both lagged the returns for the U.S. indices. The returns for both the EAFE and EM were significantly higher on a local currency basis than on a dollar basis due to the impact of the strengthening dollar. Both the EAFE and EM had a low teens return on a local currency basis compared to single digit dollar based returns. The EM index outperformed the EAFE. Weakening manufacturing activity from a lack of export demand, high energy costs, political uncertainty amid fiscal pressures, and a lack of exposure to the growth in AI dampened equity markets in Europe. Top performing developed economy countries in 2024 were Israel, Ireland, and Italy each with a double-digit gain. Top performing EM countries included Taiwan, China, and Turkey. Taiwan benefited from demand for semiconductors and AI related materials. Equities in China rebounded late in the year in reaction to announcements of more stimulus measures. Equities in Turkey benefited from falling inflation. The financials sector had the top return in the EAFE index at 21% boosted by declining interest rates in several countries. The top performing sector in the EM index was information technology due to the gains for the semiconductor stocks. Just as in the U.S. market, the materials sector had the weakest return in both the EAFE and EM.
Most sectors of the fixed income markets generated positive returns for 2024 with the exception of longer-term Treasury bonds. Generally strong economic data helped corporate bonds outperform Treasury bonds since default risk remained low and demand was robust for the higher yields available from corporate bonds. It was a momentous year for Treasury bond yields. Yields rose and declined throughout the year based on changing expectations for interest rate cuts in reaction to economic news and Fed member comments. Yields rose (and prices fell) in the first part of the year on hotter than expected inflation data and on hawkish Fed comments. In April, the 2-year Treasury bond yield rose to 5% and the 10-year yield rose to 4.7%, which were the highs for the year. In reaction, the average 30-year mortgage rate moved up to over 7%. During May yields started to drift lower on data that pointed to downside risks to economic growth and slowing inflation. In August, the U.S. government yield curve began to normalize due to expectations for an aggressive pace of cuts to the fed funds rate. The yield curve had been inverted since 2022. However, in August the difference between the 2-year and 10-year Treasury bond yields flattened. The curve returned to “normal” with longer maturity yields higher than shorter maturity yields in September. Also in September, the Fed announced the first change in interest rate policy since July 2023 with a half percentage point cut and pointed to more cuts to come. Yields dropped sharply. The 10-year yield briefly hit the lowest point of the year at 3.6%. The average 30-year mortgage rate fell to a two-year low of 6.1% and sparked a surge in refinancings. Yields moved up again starting in October as strong economic reports and comments by the Fed that there is no need to rush the pace of interest rate cuts dampened expectations for further rate cuts. Treasury bill yields ended 2024 lower than at the end of 2023 but bonds of all other maturities ended 2024 with higher yields.
The Bloomberg Commodity index had a modest positive return for 2024. There was a wide dispersion of returns among the various sub-indices. The precious metals sub-index was the performance leader with a gain of 25%. Gold hit record highs during the year. Heavy buying by central banks, particularly China, and buying due to demand for safe-haven investments due to heightened geopolitical uncertainty drove the price of gold higher. The livestock sub-index also produced a return of over 20% on tight inventories. The energy sub-index ended the year with a return of just over 1%. The price of West Texas Intermediate crude oil moved higher in the early part of the year due mostly to geopolitical tensions but declined in the second part of the year to end December up less than 1% from year-end 2023. Natural gas had a weak year. The spot price for Henry Hub liquid natural gas fell to an all-time low in November due to high supply levels and weak demand due to warm weather. In November, the U.S. had the most gas in storage since 2016. The grains sub-index was the performance laggard with a double-digit negative return due to bountiful harvests.
Outlook:
Much of the U.S. economic data continues to show resilience despite the higher interest rates from the Fed’s fight against inflation. The labor market has cooled which bears watching for clues to the health of the consumer, but unemployment remains low, wages continue to move up, and the number of job openings remains above prepandemic levels. The solid labor market has been supporting the all-important consumer spending side of the economy. However, there is a risk that the effect of higher for longer interest rates could spread beyond the housing, auto, and manufacturing sectors given the Fed’s revised projections for fewer rate cuts in 2025 and 2026 and the potential for the Trump administration’s trade and tariff policies to boost prices for a variety of goods. Outside the U.S., inflation is near central bank targets. Now the focus is on growth and the picture is mixed with services outpacing manufacturing. However, indications are that central banks will make additional interest rate cuts to support economic activity. Given the stronger growth data in the U.S. compared to various developed and emerging markets, the uncertain impact of Trump administration tariffs and trade policy on foreign economies, and the likelihood that the U.S. dollar will continue to be strong, our recommendation to be underweight non-U.S. stocks and equal weight to U.S. stocks remains in place. Major U.S. equity indices posted double-digit gains for two consecutive years. Various widely followed analysts are forecasting another double-digit gain for the S&P 500 in 2025 boosted by solid earnings growth, benefits of AI, and further interest rate cuts. However, valuation levels are high particularly for U.S. large-cap stocks. The high valuation levels increase the risk of heightened volatility due to unexpected earnings, economic, or geopolitical news. We retain the recommendation for an overweight to cash reserves.
The statistical information contained in this commentary has been compiled from publicly available sources and is presented to you for your review and for discussion purposes only. The information contained in this commentary represents the opinion of the author(s) as of its date and is subject to change at any time due to market or economic conditions. These comments do not constitute a recommendation to purchase, sell or hold any security, and should not be construed as investment advice or to predict future performance. Past performance does not guarantee future results.
The statistical information contained in this commentary was derived from sources that Vogel Consulting, LLC believes are reliable, and such information has not been independently verified by Vogel. Russell Investment Group is the source and owner of the trademarks, service marks and copyrights related to the Russell Indexes. Russell® is a trademark of the Russell Investment Group. An index is not managed and is unavailable for direct investment.
Print: Download PDF: