To borrow from Merriam‐Webster, a benchmark may be defined as: 1 a point of reference from which measurements may be made, or 2 a standardized problem or test that serves as a basis for evaluation or comparison. In the investment world, all performance reports compare investment managers to one or more benchmarks, and many reports include a weighted or global benchmark for the entire portfolio. But what about the asset allocation, how is it judged? How do you measure the performance of your chosen combination of managers and asset classes? Most performance reports do not measure the performance of the allocation itself, they only measure the pieces of the allocation.
Vogel Consulting recognized this information gap and sought to measure the impact of decisions being made at the asset allocation level. We developed a broad market benchmark to measure the performance of an allocation. When an allocation is selected by a client, we take the asset classes and broaden them one or two levels (see figure 1) to answer the question: “If I had passively invested this portfolio in broad indexes to get market exposure, what return would I have seen?” Being able to answer this question lets you compare how the allocation is doing in relation to the broad market alternative.
Figure 1
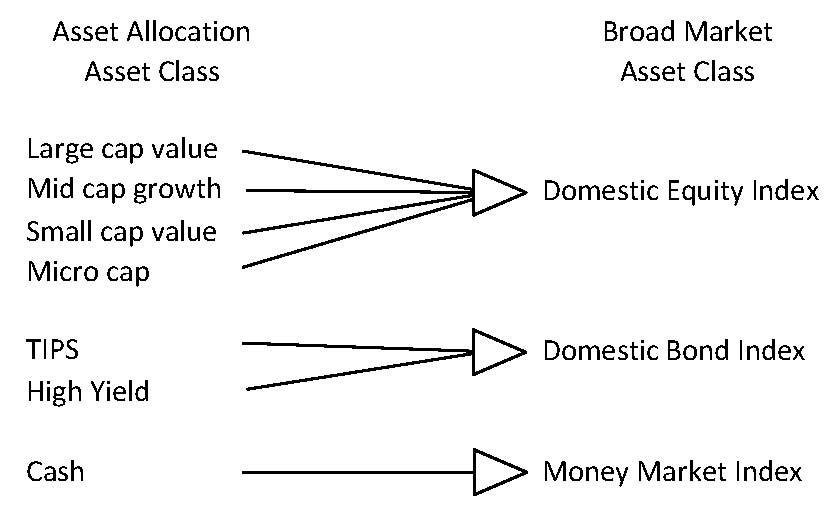
For example, in the domestic equity markets you can invest in numerous assets classes: large‐cap value, largecap growth, large‐cap core, mid‐cap value, mid‐cap growth, small‐cap value, small‐cap growth, microcap, etc. The decision to invest (or not invest) in each of those asset classes is an allocation level decision. How do you know if the decisions you made added value to the portfolio? If you compare the weighted return of your selected domestic equity managers to the Wilshire 5000, (a domestic equity index containing all domestic equity asset classes) you could determine if the decision to invest in the selected mixture of those specific asset classes added or detracted value, compared to a decision to invest in the Wilshire 5000.
True Comparison
If a similar comparison is done on all the asset classes in the portfolio, you can measure whether those allocation decisions are adding value. (This calculation assumes that if you did not specifically choose numerous asset classes, you would instead have selected a broad level index.) This concept can be applied using any type of benchmark in the same context. The key is keeping the broad market characteristics consistent so a true comparison can be made. The weightings in the broad market are also key to the consistency of the calculation. You can keep the weightings in line with the long‐term strategic allocation, as Vogel does, or you can have the weightings float with the tactical decisions in the portfolio. Our objective is to measure value added by the strategic allocation itself. Keeping the broad market allocation consistent with the strategic asset allocation allows us to measure the value added by tactical and strategic allocation decisions.
Three Levels of Detail
Our performance reporting shows three total portfolio‐level returns:
1. Portfolio since inception return
2. Portfolio weighted benchmark
3. Portfolio broad market benchmark
If you graph the three types of returns on a spectrum of comparison (see figure 2) you would like to see the inception return be the highest, followed by the weighted benchmark and then the broad market benchmark. This pattern would mean that your portfolio is outperforming the benchmark and the allocation is outperforming the broad market.
Figure 2
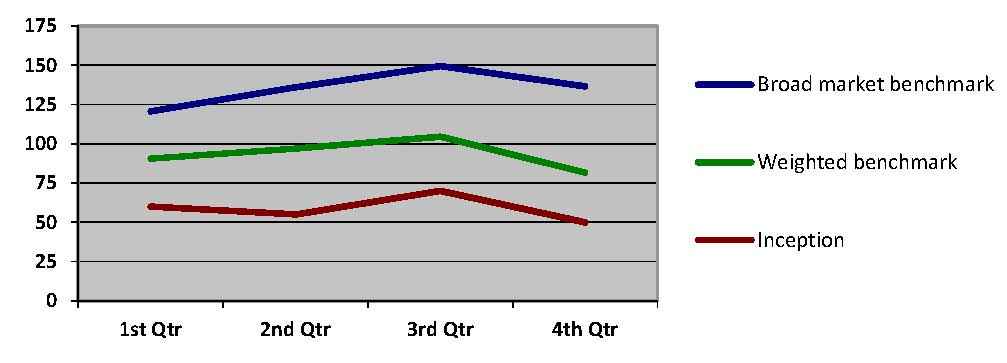
We consider the difference between the inception return and the weighted benchmark return to be the manager value‐added, and that is why you are comparing those two return figures. Performing this comparison allows you to answer the question: Did my mix of managers beat their specific benchmarks for the portfolio as a whole? The outcome is based on the managers’ performance and this standard comparison helps determine how well managers are doing as a group, over time.
Figure 3

The difference between the weighted benchmark and the broad market benchmark is the allocation value added by some of the allocation decisions made. The comparison takes the manager performance out of the analysis and just looks at benchmark to benchmark returns and answers the following questions:
• Did the selection of various asset classes in the allocation outperform the broad market?
• Are there allocation decisions in the portfolio that need to be reviewed or revisited?
• Was there a long‐term decision made in the portfolio that is having a short‐term effect?
The broad market benchmark analysis helps reveal these patterns and prompt important discussions. Such discussions often lead to asset allocation decisions that better align a client’s portfolio to their real risk tolerance.
In the current market environment, where market, sector and asset class dominance can change overnight, performing this analysis allows us to maintain a longer‐term focus. The data is available for us to use in different time periods, but the regular reporting of the data is done only on an inception‐to‐date basis. Because we advise our clients to maintain a long‐term perspective, and allocations are meant to be long‐term in nature, we want the reporting period to match the decision making period; therefore, we typically only show the broad market analysis since inception on performance reports.
Complexities
While Figure 1 shows an example of a relatively basic asset allocation of stocks, bonds, and cash, the calculation becomes more complex as additional asset classes are added. The treatment of alternative asset classes and private equity need to be analyzed to determine how they should be included in the broad market calculation. In some cases, as with private equity, it may not be included since there might not be consistent and timely calculation of returns to compare. Hedge funds could be included in the calculation in numerous ways: they could be compared against a universal hedge fund benchmark or they could be benchmarked against the broad category they are hedging. Tactical decisions also come into play in the analysis. For example, if a client decided to increase their cash balance in early 2008 as a tactical decision ‐ compared to the strategic allocation‐based broad market they would have seen a great benefit when the markets dropped significantly. However if the client kept the higher cash balance in 2009‐2012 they would have underperformed the broad market as the markets rallied strongly in those years. We have found that being able to show clients such analysis is very beneficial to their “big‐picture” understanding of their portfolio.
Our goal in performance reporting and benchmarking is to provide perspective to our clients so they can better understand their portfolios and make more informed decisions. Our performance reports not only provide data, but act as a conversation starter that results in a portfolio best positioned for the future.
DISCLOSURES
To ensure compliance with Treasury Circular 230, we are required to inform you that any advice concerning tax issues contained in this communication (including any attachments) was not intended or written to be used, and cannot be used, for the purpose of avoiding any penalties that may be imposed by any governmental taxing authority or agency.
Any performance quoted is past performance and is not a guarantee of future results.
Opinions and estimates offered constitute our judgment and are subject to change without notice, as are statements of financial market trends, which are based on current market conditions. We believe the information provided here is reliable, but do not warrant its accuracy or completeness. This material is not intended as an offer or solicitation for the purchase or sale of any financial instrument. The views and strategies described may not be suitable for all investors. This material has been prepared for informational purposes only, and is not intended to provide, and should not be relied on for, accounting, legal or tax advice. References to future returns are not promises or even estimates of actual returns a client portfolio may achieve. Any forecasts contained herein are for illustrative purposes only and are not to be relied upon as advice or interpreted as a recommendation.